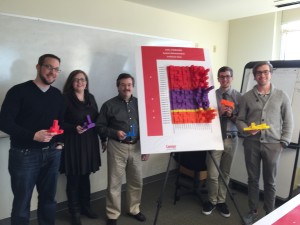
Come see how the University of Cincinnati and Xavier University used 3D printing technology to visualize student activity in Blackboard courses across an entire semester. Four dimensions of data (students, time, activity levels, and grades) are represented using x, y, & z axes plus color in the resulting 3’ x 4’ models. These 3D models allow the viewer to identify patterns in student activity that are not otherwise apparent. In this session, we will cover how UC extracted the underlying data from Bb, how it was converted to a 3D virtual model using Blender, and the collaboration between UC and Xavier to turn that data into a physical model.
Student activity was extracted from the Blackboard database, converted to 3D models using Blender, and then printed using several MakerBot Replicator printers.


